Analyzing 85 GB of PCAP in 2 hours

Lets say you've collected around 100 GB of PCAP files in a network monitoring installation. How would you approach the task of looking at the application layer data of a few of the captured sessions or flows?
For much smaller datasets, in the order of 100 MB, one would typically load the PCAP into Wireshark and perform ”Follow TCP Stream” on a few sessions to see what's going on. But loading gigabyte datasets into Wireshark doesn't scale very well, in fact Wireshark will typically run out of RAM and crash saying “Out Of Memory!” or just “Wireshark has stopped working”. Ulf Lamping explains why on the Wireshark Wiki:
“Wireshark uses memory to store packet meta data (e.g. conversation and fragmentation related data) and to display this info on the screen.
[...]
I need memory about ten times the actual capture file size”
The solution I'm proposing is to instead download the free version of CapLoader, load the PCAP files into CapLoader and perform ”Flow Transcript” on a few of the flows. So how long time would it take to do this on 100 GB of PCAP files? I did a quick test and loaded the 85 GB dataset from ISCX 2012 into CapLoader on an ordinary laptop computer. After just 1 hour 47 minutes all of the PCAP files from ISCX 2012 were loaded and indexed by CapLoader! Also, please note that datasets this large can be parsed in less than 30 minutes with a more powerful PC.
After having loaded all the PCAP files CapLoader presents a list of all the 2.066.653 indexed flows from the ISCX 2012 dataset. Right-clicking a UDP or TCP flow brings up a context menu that allows you to generate a “Flow Transcript”, this feature is basically the same thing as Wireshark's “Follow TCP Stream”.
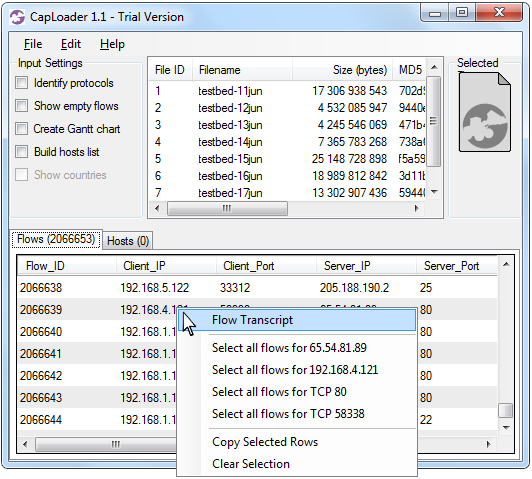
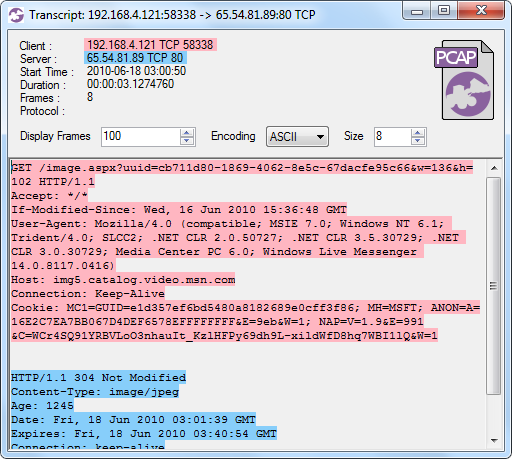
CapLoader's Flow Transcript View
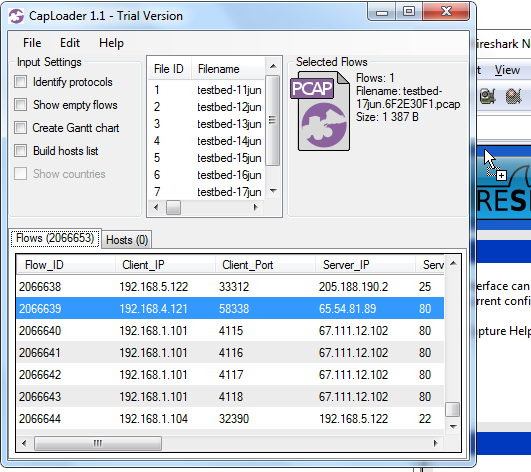
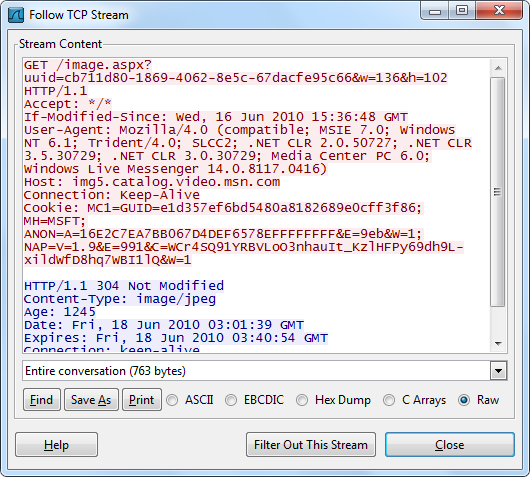
You can, of course, always extract the frames from any flow directly to Wireshark if you aren't ready to abandon Wireshark's Follow TCP Stream just yet. A flow is extracted simply by selecting a flow in the list and then doing drag-and-drop from CapLoader's PCAP icon (at the top right) onto Wireshark.
The fact that CapLoader parses and indexes large PCAP files very fast and that the analyst is provided with powerful tools, like the Transcript feature, to look at the raw packet data makes it possible to perform big-data network traffic analysis using an ordinary PC. This means that you do NOT need to upload your network traffic to the Cloud, or build a 100-machine cluster, in order to let a Hadoop instance parse though your multi-gigabyte packet captures. All you need is an ordinary PC and a copy of CapLoader.
For more information about CapLoader please have a look at our blog post highliting the new features in version 1.1 of CapLoader or browse through all our blog posts about CapLoader.
This blog post makes use of the UNB ISCX 2012 Intrusion Detection Evaluation Dataset, which is created by Ali Shiravi, Hadi Shiravi, and Mahbod Tavallaee from University of New Brunswick
UPDATE 2016-05-23
With the release of CapLoader 1.4 it is now possible to perform flow transcripts not only from the Flows tab, but also from the Services and Hosts tab. In these cases the transcript will be that of the first flow of the selected service or host.
Posted by Erik Hjelmvik on Thursday, 24 January 2013 12:20:00 (UTC/GMT)
Tags: #CapLoader #PCAP #gigabyte #GB #Wireshark #Follow TCP Stream #transcript #Big Data