NETRESEC Network Security Blog - Tag : sniffer

rss Google News

Remote Sniffing from Mikrotik Routers

One of the new features in NetworkMiner 2.9 is a TZSP streaming server. It is designed to read a real-time stream of sniffed packets from Mikrotik routers. This method for remote sniffing can be used to capture packets regardless if NetworkMiner is running in Windows or Linux.

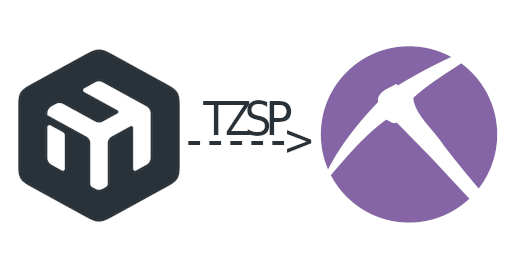
Sniff Packets with Mikrotik TZSP to NetworkMiner

How to Sniff Packets with TZSP

Open a console or terminal on the Mikrotik router and run “/tool sniffer print” to see the current settings. Then run the following commands to configure the sniffer:

  • /tool sniffer
  • set streaming-enabled=yes
  • set streaming-server=10.1.2.3:37008
  • set filter-stream=yes

Replace 10.1.2.3 with the IP address of the computer running NetworkMiner

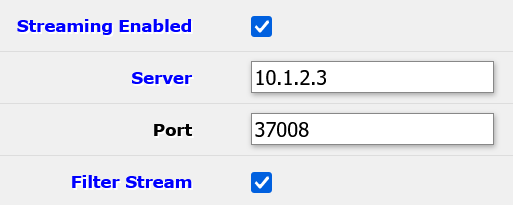
It is also possible to activate the sniffer from the RouterOS WebFig interface.

  • Expand the “Tools” section
  • Click “Packet Sniffer”
  • Check “Streaming Enabled”
  • Enter IP of computer running NetworkMiner in Server
  • Enter 37008 as Port
  • Check “Filter Stream”
  • Click the “Apply” button at the top
Mikrotik WebFig Packet Sniffer settings

The “filter-stream” setting prevents the sniffer from capturing packets that are sent to the streaming-server (i.e. NetworkMiner). This setting must be enabled to avoid a snowball effect, where copies of previously captured packets get sniffed and re-transmitted to the streaming-server.

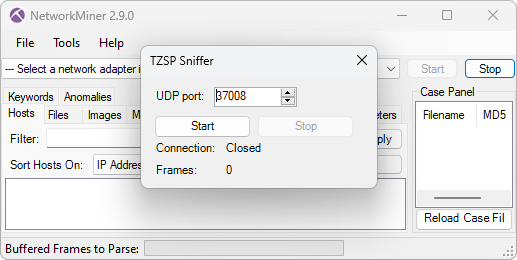
The next step is to open the TZSP window in NetworkMiner, which you’ll find under “File, Receive TZSP Stream”.

NetworkMiner TZSP Sniffer

Click “Start” in NetworkMiner’s TZSP window, so that it listens for an incoming TZSP stream on UDP port 57008. Go back to the Mikrotik router, where you start the sniffer with “/tool sniffer start” or by clicking the “Start” button in the WebFig. You should now see the Frames counter increasing in NetworkMiner's TZSP window. You’ll probably also notice that artifacts get added to the main NetworkMiner window in the background as more packets are received.

Close the sniffer by running “/tool sniffer stop” or clicking the “Stop” button in WebFig, then click “Stop” in NetworkMiner. You can now close NetworkMiner’s TZSP window to view the artifacts that NeworkMiner has extracted from the captured traffic.

Posted by Erik Hjelmvik on Thursday, 30 May 2024 13:05:00 (UTC/GMT)

Tags: #TZSP#NetworkMiner#sniffer

Short URL: https://netresec.com/?b=2459ed5


RawCap Redux

RawCap A new version of RawCap has been released today. This portable little sniffer now supports writing PCAP data to stdout and named pipes as an alternative to saving the captured packets to disk. We have also changed the target .NET Framework version from 2.0 to 4.7.2, so that you can run RawCap on a modern Windows OS without having to install a legacy .NET Framework.

Here’s a summary of the improvements in the new RawCap version (0.2.0.0) compared to the old version (0.1.5.0):

  • Uses .NET 4.7.2 instead of 2.0
  • Support for writing to stdout
  • Support for writing to named pipes
  • Large (64 MB) ring buffer to prevent packet drops
  • Automatic firewall configuration

Out of the software we develop and maintain here at Netresec, NetworkMiner is the most popular one. But you’re probably not aware that RawCap is our second most popular tool in terms of downloads, with around 100 unique downloads every day. RawCap started out as just being a quick hack that we released for free to the community in 2011 without expecting it to gain much attention. However, it quickly gained popularity, maybe due to the fact that it’s just a tiny .exe file and that it doesn’t require any external libraries or DLL’s to sniff network traffic (other than the .NET Framework).

RawCap embraces the Unix philosophy to do only one thing, and do it well. Thanks to RawCap’s simplicity we have only needed to make a few minor updates of the tool since its first release 9 years ago. However, today we’re finally adding some new features that have been requested by users over the years. One such feature is that RawCap now automatically creates a Windows firewall rule when the tool is started. Before this feature was introduced users would have to run wf.msc (i.e. the "Windows Defender Firewall with Advanced Security") and manually create an inbound rule to allow RawCap.exe to receive incoming traffic. Without such a firewall rule RawCap would only be able to capture outgoing traffic.

RawCap can be started in two different modes. Either as an interactive console application, or as a “normal” command line utility. Run RawCap.exe without any arguments, or simply double click the RawCap.exe icon to use the interactive mode. You will then be asked which interface to capture packets from and what filename you’d like to save them to.

F:\Tools>RawCap.exe
Network interfaces:
0.     192.168.0.17    Local Area Connection
1.     192.168.0.47    Wireless Network Connection
2.     90.130.211.54   3G UMTS Internet
3.     192.168.111.1   VMware Network Adapter VMnet1
4.     192.168.222.1   VMware Network Adapter VMnet2
5.     127.0.0.1       Loopback Pseudo-Interface
Select network interface to sniff [default '0']: 1
Output path or filename [default 'dumpfile.pcap']:
Sniffing IP : 192.168.0.47
Output File : dumpfile.pcap
 --- Press [Ctrl]+C to stop ---
Packets     : 1337

The other alternative is to supply all the arguments to RawCap when it is started. Use “RawCap --help” to show which arguments you can use. You’ll need to use this mode if you want to write the captured traffic to standard output (stdout) or a named pipe, or if you want RawCap to automatically stop capturing after a certain time or packet count.

F:\Tools>RawCap.exe --help
NETRESEC RawCap version 0.2.0.0

Usage: RawCap.exe [OPTIONS] <interface> <pcap_target>
 <interface> can be an interface number or IP address
 <pcap_target> can be filename, stdout (-) or named pipe (starting with \\.\pipe\)

OPTIONS:
 -f          Flush data to file after each packet (no buffer)
 -c <count>  Stop sniffing after receiving <count> packets
 -s <sec>    Stop sniffing after <sec> seconds
 -m          Disable automatic creation of RawCap firewall entry
 -q          Quiet, don't print packet count to standard out

INTERFACES:
 0.     IP        : 169.254.63.243
        NIC Name  : Local Area Connection
        NIC Type  : Ethernet

 1.     IP        : 192.168.1.129
        NIC Name  : WiFi
        NIC Type  : Wireless80211

 2.     IP        : 127.0.0.1
        NIC Name  : Loopback Pseudo-Interface 1
        NIC Type  : Loopback

 3.     IP        : 10.165.240.132
        NIC Name  : Mobile 12
        NIC Type  : Wwanpp

Example 1: RawCap.exe 0 dumpfile.pcap
Example 2: RawCap.exe -s 60 127.0.0.1 localhost.pcap
Example 3: RawCap.exe 127.0.0.1 \\.\pipe\RawCap
Example 4: RawCap.exe -q 127.0.0.1 - | Wireshark.exe -i - -k

As you can see, running “RawCap.exe -s 60 127.0.0.1 localhost.pcap” will capture packets from localhost to a file called “localhost.pcap” for 60 seconds and then exit.

There are a couple of drawbacks with the new RawCap version though, it is a larger binary (48kB instead of 23kB) and it uses more CPU and RAM compared to the old version. We will therefore continue making the old RawCap version available to anyone who might need it.

Visit the RawCap product page to download this tool and learn more.

Posted by Erik Hjelmvik on Thursday, 30 January 2020 14:32:00 (UTC/GMT)

Tags: #Netresec#RawCap#sniffer#PCAP#named pipe#Wireshark#WiFi#loopback#127.0.0.1

Short URL: https://netresec.com/?b=201683e


PacketCache lets you Go Back in Time

PacketCache logo

Have you ever wanted to go back in time to get a PCAP of something strange that just happened on a PC?
I sure have, many times, which is why we are now releasing a new tool called PacketCache. PacketCache maintains a hive of the most important and recent packets, so that they can be retrieved later on, if there is a need.

Network forensics and incident response is performed post-event, but requires that packet have already been captured during the event to be analyzed. Starting a network sniffer after a suspected intrusion might provide useful insight on what the intruders are up to, but it is much better to be able to go back in time to observe how they gained access to the network and what they did prior to being detected. Many companies and organizations combat this problem by setting up one or several solutions for centralized network packet capturing. These sniffers are typically installed at choke-points on the network, such as in-line with a firewall. However, this prevents the sniffers from capturing network traffic going between hosts on the same local network. Intruders can therefore often perform lateral movement on a compromised network without risk getting their steps captured by a packet sniffer.

Logo for Back to the Future series logo - public domain

USB broadband modem, credit: Game Gavel (cc-by-sa-3.0)
Image by Game Gavel
We're now trying to improve the situation for the defenders by releasing PacketCache, which is a free (Creative Commons licensed) Windows service that is designed to continuously monitor the network interfaces of a computer and store the captured packets in memory (RAM). PacketCache monitors all IPv4 interfaces, not just the one connected to the corporate network. This way traffic will be captured even on public WiFi networks and Internet connections provided through USB broadband modems (3G/4G).

By default PacketCache reserves 1% of a computer's total physical memory for storing packets. A computer with 4 GB of RAM will thereby allow up to 40 MB of packets to be kept in memory. This might not seem like much, but PacketCache relies on a clever technique that allows it to store only the most important packets. With this technique just 40 MB of storage can be enough to store several days worth of “important” packets.

The “clever technique” we refer to is actually a simple way of removing packets from TCP and UDP sessions as they get older. This way recent communication can be retained in full, while older data us truncated at the end (i.e. only the last packets are removed from a session).

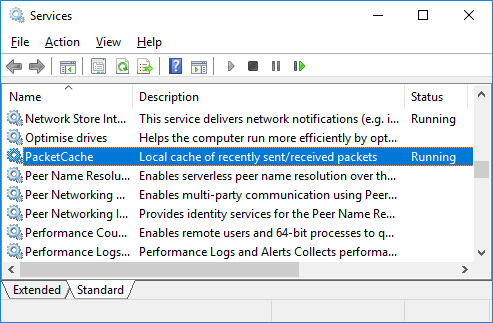
PacketCache services in services.msc

To download PacketCache or learn more about this new tool, please visit the official PacketCache page:
https://www.netresec.com/?page=PacketCache

PCAP or it didn't happen!

Posted by Erik Hjelmvik on Wednesday, 28 September 2016 11:45:00 (UTC/GMT)

Tags: #PacketCache#PCAP#NSM#forensics#Windows#sniffer#memory#DFIR

Short URL: https://netresec.com/?b=169d0d2


From 4SICS with ICS PCAP Files

I attended to the Swedish industrial cyber security conference 4SICS last month and brought back a bunch of PCAP files. Not just any PCAP files, but captured network traffic from the ICS lab that was set up in the Geek Lounge at 4SICS. These PCAP files are now made publicly available here, because captured network traffic from ICS/SCADA networks is a really scarce resource.

4SICS logo 4SICS is the the leading Industrial Control System (ICS) security conference in Europe, which brings in speakers and attendees from all around the world. I tought a one-day class on analyzing network traffic as part of the pre-conference training at 4SICS. In this class we analyzed PCAP files containing industrial protocols, such as Modbus/TCP and IEC-104. Unfortunately there aren't many capture files around that carry these protocols, so the ICS analysis part in my class wasn't as advanced as I wanted it to be.

I have been aware of this limited access to ICS traffic for some time now, which is why I decided to work with the 4SICS crew in order to set up a sniffer in the ICS lab at the 4SICS conference. This lab contained devices such as PLCs, RTUs, servers, industrial network equipment (switches, firewalls, etc), which were available for hands-on "testing" by 4SICS attendees.

4SICS ICS lab
4SICS ICS Lab. Image Credit: 4SICS

The network TAP vendor Garland were Technology Partners at 4SICS, so I didn't even have to bring a network TAP to the lab. I just connected my sniffer machine and let it record for three days. Chris Sistrunk also joined the sniffing party later in the conference by connecting his SEL-3355, which runs SecurityOnion, to the network TAP.

4SICS Network TAP and Sniffers Image Credit: Patrick Nixdorf

The 350MB of network traffic that was captured during the 4SICS conference is now publicly available here:
https://www.netresec.com/?page=PCAP4SICS

Enjoy!

Posted by Erik Hjelmvik on Wednesday, 04 November 2015 15:45:00 (UTC/GMT)

Tags: #ICS#SCADA#PCAP#4SICS#IEC-104#Modbus#sniffer#PLC

Short URL: https://netresec.com/?b=15BE77F

X / twitter

NETRESEC on X / Twitter: @netresec

Mastodon

NETRESEC on Mastodon: @netresec@infosec.exchange