Erik Hjelmvik
,
Monday, 27 May 2024 09:50:00 (UTC/GMT)

NetworkMiner 2.9 brings several new and improved features to help analysts make sense of network traffic from malware, criminals and industrial control systems. Highlights from this new version include:
- TZSP support
- StealC extractor
- Improved Modbus parser
- JA4 support
- GTP decapsulation
Malware Traffic Artifact Extraction
NetworkMiner is a popular tool for extracting artifacts from malware traffic.
Such artifacts can be downloaded malware modules, exfiltrated documents and sometimes even screenshots of the infected computer.
Parsers for njRAT and BackConnect (à la IcedID, QakBot and Bazar) traffic was previously added to NetworkMiner.
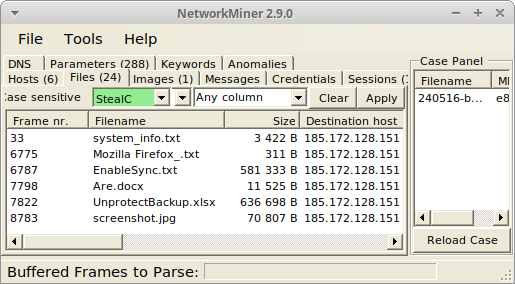
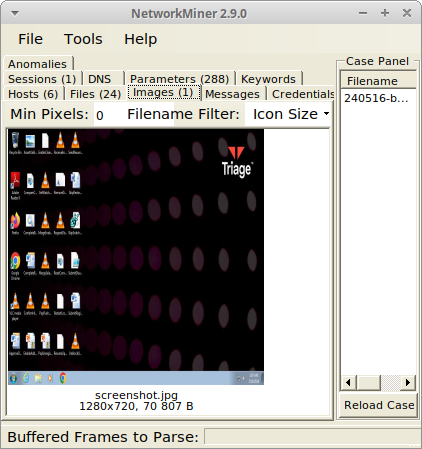
In this release NetworkMiner also gets a parser for StealC, which has quickly become one of the most popular information stealers on Russian-speaking underground forums. The new NetworkMiner 2.9 release extracts screenshots and files that SteakC exfiltrates from the infected machine.
The examples shown below were created by loading a pcap file with StealC traffic from Triage sandbox into NetworkMiner 2.9.
NetworkMiner was run in Linux to minimize the risk of accidentally infecting the analysis environment.

Image: Reassembled system info and documents exfiltrated by StealC to 185.172.128.151

Image: Reassembled screenshot of victim’s desktop sent to StealC C2 server
NetworkMiner’s VNC and BackConnect VNC parser has also been improved in this release. NetworkMiner’s keylog extraction from VNC now supports lots of keyboard layouts, including Arabic, Cyrillic, Greek, Hebrew, Kana, Korean and Thai. The handling of VNC color profiles has also been improved to convey colors more correctly in screenshots from reassembled VNC and BackConnect VNC traffic.
I’d like to thank Brad Duncan and Maxime Thiebaut for their valuable input on this matter!
Another remote management tool that often is misused by hackers and criminals is Remote Manipulator System (RMS) from TektonIT.
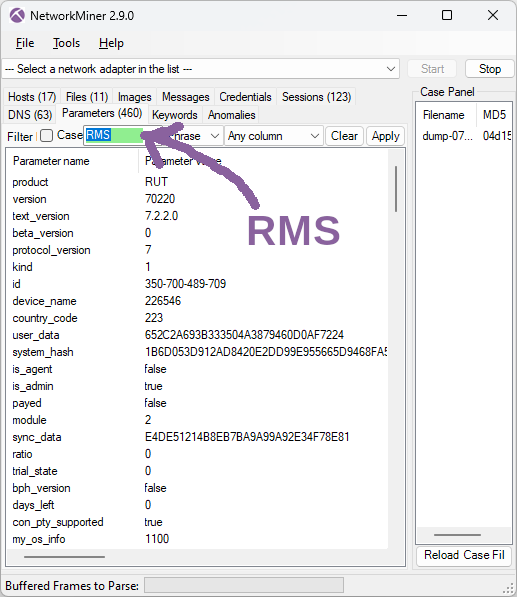
According to Cyberint’s report Legit remote admin tools turn into threat actors’ tools there are lots of Russian forum posts and even YouTube tutorials showing how to include legitimate RMS components in malware. NetworkMiner now parses RMS’s session setup, which includes information about the client computer as well as the RMS product and version.
The screenshot below was created by loading a pcap file from when 3_Рахунок.pdf.exe was executed in JoeSandbox.

Image: Information extracted from RMS traffic
The country_code number (here 223) also gets converted to a human-readable country (Switzerland) by NetworkMiner, but this country name info is only displayed in the Host Details of the client.
ICS / SCADA
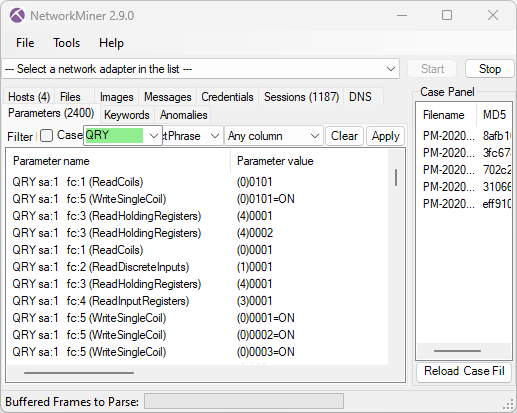
NetworkMiner has supported Modbus/TCP since 2016 (when NetworkMiner 2.0 was released). This Modbus parser has now been updated to display Modbus addresses using the Modicon convention, which explicitly specifies the register type while also signalling to the user that the displayed addresses are one-indexed.

The register types are displayed in parenthesis and should be interpreted as follows:
- (0)nnnn = Coil
- (1)nnnn = Discrete input
- (3)nnnn = Input register
- (4)nnnn = Holding register
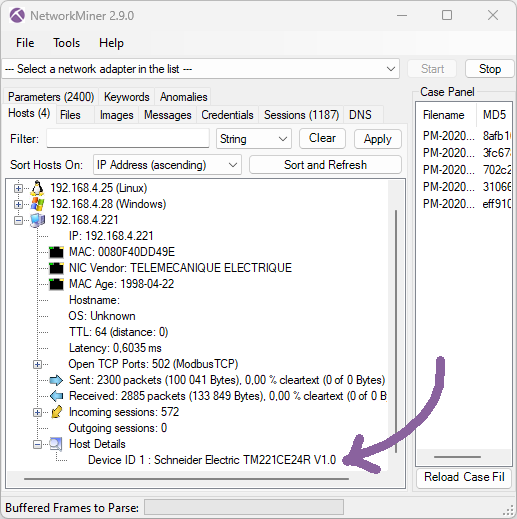
NetworkMiner now also reads Modbus Device Identification messages and displays the reported device info in Host Details. This feature is very handy if you’re building an asset inventory through passive asset discovery (i.e. passively monitoring traffic to identify devices).

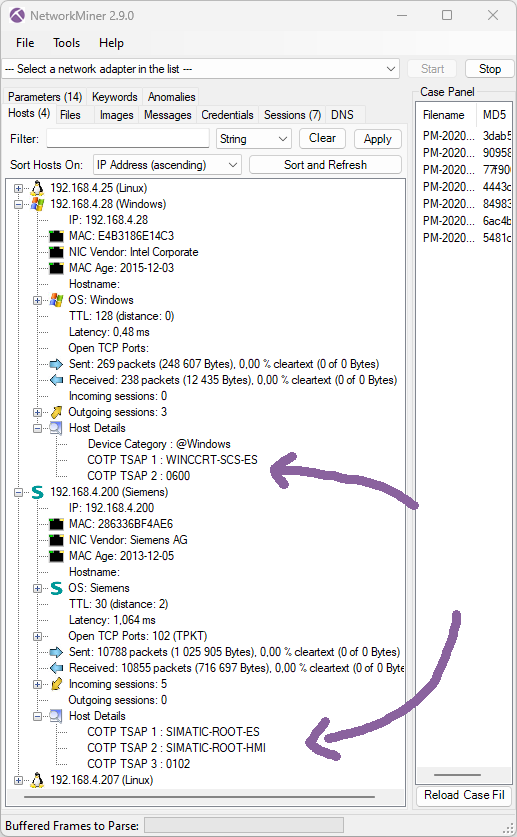
NetworkMiner 2.9 also supports asset identification for ICS networks that use COTP based protocols, such as Siemens S7 protocol or IEC 61850 MMS, by parsing COTP connection request messages. The identified COTP TSAP names are displayed under Host Details.

Image: NetworkMiner showing a WinCC client and a Siemens SIMATIC device
User Interface Improvements
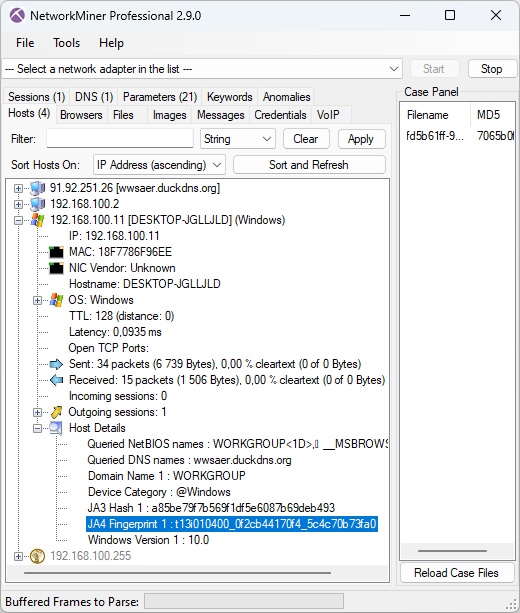
TLS handshake fingerprinting with JA3 was added to NetworkMiner in 2019, but last year John Althouse announced the new JA4+ fingerprint methods. In short JA4+ is a suite of methods designed to fingerprint implementations of a specific set of protocols, including TLS, HTTP and SSH. Most of the fingerprinting methods in the JA4+ suite are patent pending except for the TLS client fingerprinting method JA4, which is an improved version of JA3. NetworkMiner now generates both JA3 and JA4 fingerprints for TLS handshakes. The results from the TLS fingerprinting can be seen in the Parameters tab as well as Host Details.
In the example below we’ve loaded TLS traffic to port 8533 on 91.92.251.26 from a Remcos sample on ANY.RUN into NetworkMiner Professional (the free NetworkMiner edition doesn’t parse TLS traffic to non-standard ports).

Image: JA4 hash t13i010400_0f2cb44170f4_5c4c70b73fa0 for Remcos C2 traffic
NetworkMiner has also been improved to extract even more information from HTTP traffic, such as JSON formatted parameters and telemetry data sent to Microsoft by their Device Metadata Retrieval Client (DMRC). We have also improved the DNS extraction, both with regards to DNS TXT labels and Additional Resource Records.
The previous Remcos screenshot displays a latency measurement (0.0935 ms), which is another new feature in this release. This latency value is an estimation of the average timespan from when the host sends a packet until it gets captured by the sniffer. NetworkMiner’s hosts list can be sorted based on the Latency value, whereby local computers and network devices are shown at the top of the list. Another way to achieve similar results is to instead sort the hosts based on “Router Hops Distance”.
NetworkMiner’s user interface has also been improved to make it easier to copy text from the Hosts and Parameters tabs with Ctrl+C or by right-clicking and selecting “Copy …”. The export-to-file function in NetworkMiner Professional now additionally includes data from the Keywords tab.
TZSP Sniffing and Decapsulation
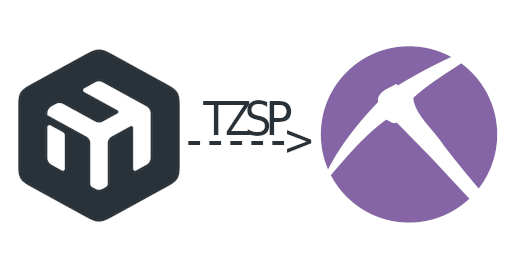
Routers from Mikrotik have a feature called TZSP (short for TaZmen sniffer Protocol), which encapsulates captured traffic into TZSP packets and then transmits them to a streaming server. This feature is similar to PCAP-over-IP and ERSPAN, except TZSP transports the sniffed packets over UDP instead of TCP or GRE.
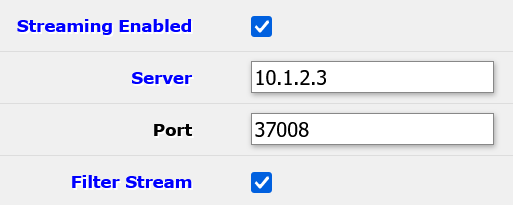
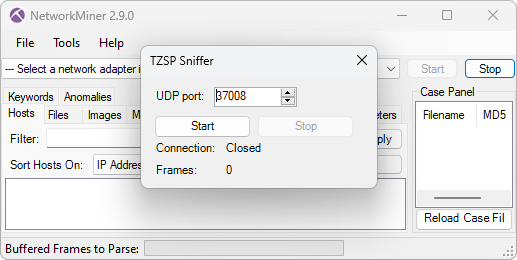
NetworkMiner now includes a TZSP streaming server, which can receive TZSP encapsulated traffic over a UDP socket. Click “File, Receive TZSP Stream”, select a port (default is 37008) and click “Start” to receive a real-time stream of captured packets from a Mikrotik router. We’ve also added support for TZSP link layer type (DLT_TZSP) pcap files as well as decapsulation of TZSP packets to UDP port 37008.
I’d like to thank Jarmo Lahtiranta for proposing this feature!
Speaking of decapsulation – we’ve added a GTP-U parser, which enables NetworkMiner to analyze GPRS traffic from GSM, UMTS, LTE and 5G networks that is transmitted inside a GTP tunnel.
Upgrading to Version 2.9
Users who have purchased NetworkMiner Professional can download version 2.9 from our customer portal, or use the “Check for Updates” feature from NetworkMiner's Help menu. Those who instead prefer to use the free and open source version can grab the latest version of NetworkMiner from the official NetworkMiner page.
Posted by Erik Hjelmvik on Monday, 27 May 2024 09:50:00 (UTC/GMT)
Tags: #NetworkMiner
#TZSP
#Modbus
#JA4
#BackConnect
#VNC
#JSON

