NETRESEC Network Security Blog - Tag : IDS

rss Google News

Sniffing Decrypted TLS Traffic with Security Onion

Wouldn't it be awesome to have a NIDS like Snort, Suricata or Zeek inspect HTTP requests leaving your network inside TLS encrypted HTTPS traffic? Yeah, we think so too! We have therefore created this guide on how to configure Security Onion to sniff decrypted TLS traffic with help of PolarProxy.

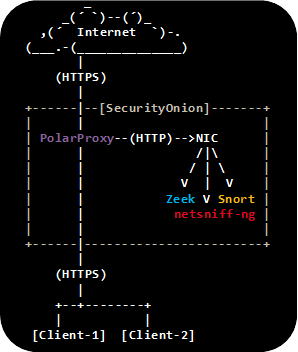
Network drawing with Clients, SecurityOnion and the Internet

PolarProxy is a forward TLS proxy that decrypts incoming TLS traffic from clients, re-encrypts it and forwards it to the server. One of the key features in PolarProxy is the ability to export the proxied traffic in decrypted form using the PCAP format (a.k.a. libpcap/tcpdump format). This makes it possible to read the decrypted traffic with external tools, without having to perform the decryption again. It also enables packet analysis using tools that don't have built-in TLS decryption support.

This guide outlines how to configure PolarProxy to intercept HTTPS traffic and send the decrypted HTTP traffic to an internal network interface, where it can be sniffed by an IDS.

STEP 1 ☆ Install Ubuntu

Download and install the latest SecurityOnion ISO image, but don't run the "Setup" just yet.

STEP 2 ☆ Add a Dummy Network Interface

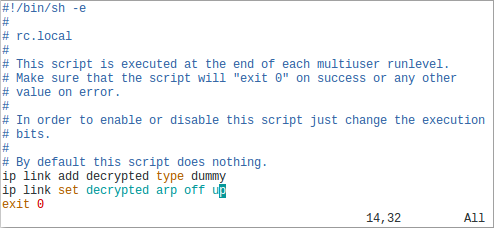
Add a dummy network interface called "decrypted", to which decrypted packets will be sent.

ip link add decrypted type dummy
ip link set decrypted arp off up
Add the commands above to /etc/rc.local before "exit 0" to have the network interface automatically configured after reboots.

dummy interface in rc.local

STEP 3 ☆ Install Updates

Install updates in Security Onion by running "sudo soup".

STEP 4 ☆ Run the Security Onion Setup

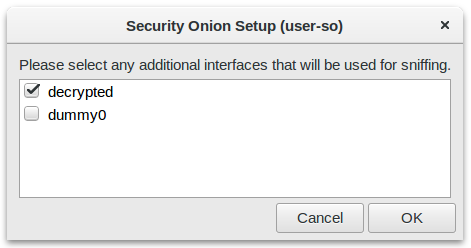
Run the Security Onion setup utility by double-clicking the "Setup" desktop shortcut or executing "sudo sosetup" from a terminal. Follow the setup steps in the Production Deployment documentation and select "decrypted" as your sniffing interface.

Sniffing Interface Selection Window

Reboot and run Setup again to continue with the second phase of Security Onion's setup. Again, select "decrypted" as the interface to be monitored.

STEP 5 ☆ Install PolarProxy Service

Download and install PolarProxy:

sudo adduser --system --shell /bin/bash proxyuser
sudo mkdir /var/log/PolarProxy
sudo chown proxyuser:root /var/log/PolarProxy/
sudo chmod 0775 /var/log/PolarProxy/

sudo su - proxyuser
mkdir ~/PolarProxy
cd ~/PolarProxy/
curl https://www.netresec.com/?download=PolarProxy | tar -xzf -
exit

sudo cp /home/proxyuser/PolarProxy/PolarProxy.service /etc/systemd/system/PolarProxy.service

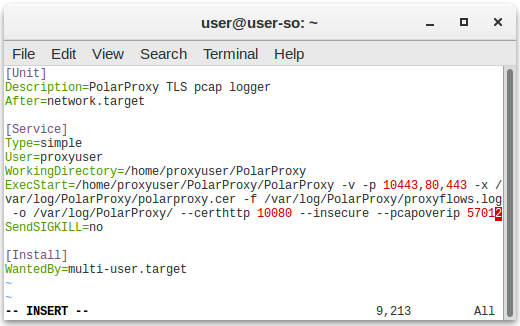
Edit /etc/systemd/system/PolarProxy.service and add "--pcapoverip 57012" at the end of the ExecStart command.

--pcapoverip 57012 in PolarProxy.service

Start the PolarProxy systemd service:

sudo systemctl enable PolarProxy.service
sudo systemctl start PolarProxy.service

STEP 6 ☆ Install Tcpreplay Service

The decrypted traffic can now be accessed via PolarProxy's PCAP-over-IP service on TCP 57012. We can leverage tcpreplay and netcat to replay these packets to our dummy network interface in order to have them picked up by Security Onion.

nc localhost 57012 | tcpreplay -i decrypted -t -
However, it's better to create a systemd service that does this automatically on bootup. We therefore create a file called /etc/systemd/system/tcpreplay.service with the following contents:
[Unit]
Description=Tcpreplay of decrypted traffic from PolarProxy
After=PolarProxy.service

[Service]
Type=simple
ExecStart=/bin/sh -c 'nc localhost 57012 | tcpreplay -i decrypted -t -'
Restart=on-failure
RestartSec=3

[Install]
WantedBy=multi-user.target

Start the tcpreplay systemd service:

sudo systemctl enable tcpreplay.service
sudo systemctl start tcpreplay.service

STEP 7 ☆ Add firewall rules

Security Onion only accepts incoming connections on TCP 22 by default, we also need to allow connections to TCP port 10443 (proxy port), and 10080 (root CA certificate download web server). Add allow rules for these services to the Security Onion machine's firewall:

sudo ufw allow in 10443/tcp
sudo ufw allow in 10080/tcp

Verify that the proxy is working by running this curl command on a PC connected to the same network as the Security Onion machine:

curl --insecure --connect-to www.netresec.com:443:[SecurityOnionIP]:10443 https://www.netresec.com/
Note: You can even perform this test from a Win10 PC, since curl is included with Windows 10 version 1803 and later.

Add the following lines at the top of /etc/ufw/before.rules (before the *filter section) to redirect incoming packets on TCP 443 to PolarProxy on port 10443.

*nat
:PREROUTING ACCEPT [0:0]
-A PREROUTING -i enp0s3 -p tcp --dport 443 -j REDIRECT --to 10443
COMMIT

Note: Replace "enp0s3" with the Security Onion interface to which clients will connect.

After saving before.rules, reload ufw to activate the port redirection:

sudo ufw reload

Verify that you can reach the proxy on TCP 443 with this command:

curl --insecure --resolve www.netresec.com:443:[SecurityOnionIP] https://www.netresec.com/

STEP 8 ☆ Redirect HTTPS traffic to PolarProxy

It's now time to configure a client to run its HTTPS traffic through PolarProxy. Download and install the PolarProxy X.509 root CA certificate from PolarProxy's web service on TCP port 10080:

http://[SecurityOnionIP]:10080/polarproxy.cer

Install the certificate in the operating system and browser, as instructed in the PolarProxy documentation.

You also need to forward packets from the client machine to the Security Onion machine running PolarProxy. This can be done either by configuring a local NAT rule on each monitored client (STEP 8.a) or by configuring the default gateway's firewall to forward HTTPS traffic from all clients to the proxy (STEP 8.b).

STEP 8.a ☆ Local NAT

Use this firewall rule on a Linux client to configure it to forward outgoing HTTPS traffic to the Security Onion machine:

sudo iptables -t nat -A OUTPUT -p tcp --dport 443 -j DNAT --to [SecurityOnionIP]

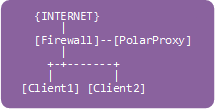
STEP 8.b ☆ Global NAT Network drawing Firewall, PolarProxy, Clients

If the client isn't running Linux, or if you wanna forward HTTPS traffic from a whole network to the proxy, then apply the following iptables rules to the firewall in front of the client network. See "Routing Option #2" in the PolarProxy documentation for more details.

  1. Add a forward rule on the gateway to allow forwarding traffic to our PolarProxy server:
    sudo iptables -A FORWARD -i eth1 -d [SecurityOnionIP] -p tcp --dport 10443 -m state --state NEW -j ACCEPT
  2. Add a DNAT rule to forward 443 traffic to PolarProxy on port 10443:
    sudo iptables -t nat -A PREROUTING -i eth1 -p tcp --dport 443 -j DNAT --to [SecurityOnionIP]:10443
  3. If the reverse traffic from PolarProxy to the client doesn't pass the firewall (i.e. they are on the same LAN), then we must add this hide-nat rule to fool PolarProxy that we are coming from the firewall:
    sudo iptables -t nat -A POSTROUTING -o eth1 -d [SecurityOnionIP] -p tcp --dport 10443 -j MASQUERADE
For other network configurations, please see the various routing setups in the PolarProxy documentation.

STEP 9 ☆ Inspect traffic in SecurityOnion

Wait for the Elastic stack to initialize, so that the intercepted network traffic becomes available through the Kibana GUI. You can check the status of the elastic initialization with "sudo so-elastic-status".

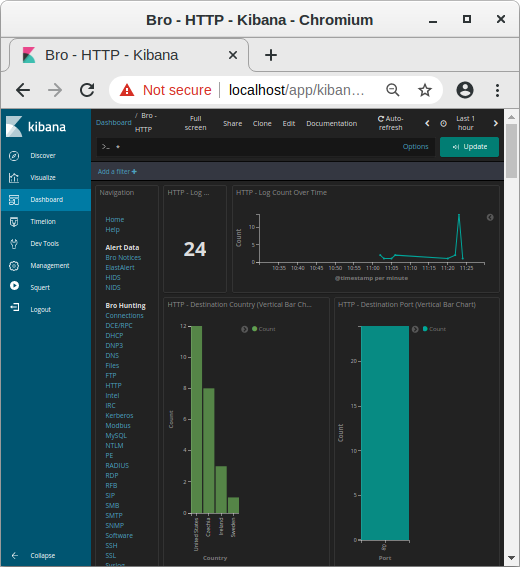
You should now be able to inspect decrypted traffic in Security Onion using Kibana, Squert, Sguil etc., just as if it was unencrypted HTTP.

Bro HTTP traffic in Kibana Image: Kibana showing HTTP traffic info from decrypted HTTPS sessions
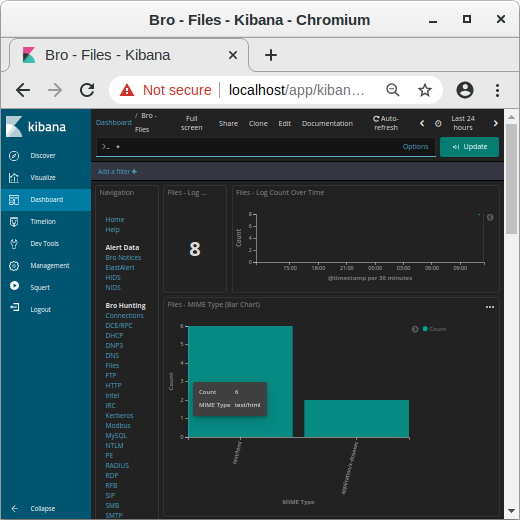
MIME types in Kibana Image: MIME types in Kibana
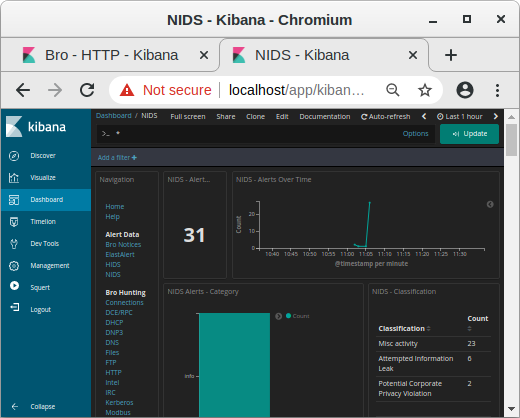
NIDS alerts in Kibana Image: NIDS alerts from payload in decrypted traffic shown in Kibana
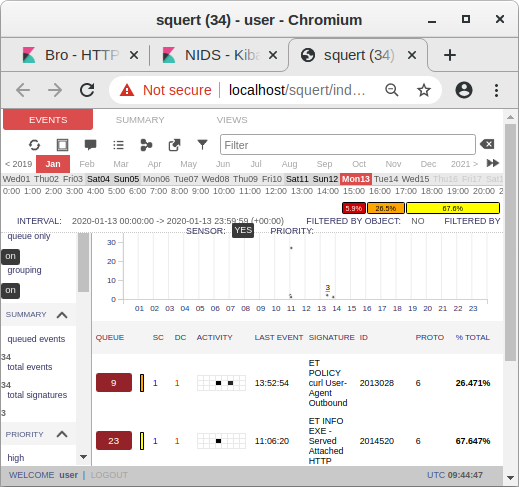
Snort alerts in Squert Image: Snort alerts from decrypted traffic shown in Squert
Security Considerations and Hardening

Security Onion nodes are normally configured to only allow access by SOC/CERT/CSIRT analysts, but the setup described in this blog post requires that "normal" users on the client network can access the PolarProxy service running on the Security Onion node. We therefore recommend installing PolarProxy on a dedicated Security Onion Forward Node, which is configured to only monitor traffic from the proxy.

We also recommend segmenting the client network from the analyst network, for example by using separate network interfaces on the Security Onion machine or putting it in a DMZ. Only the PolarProxy service (TCP 10080 and 10443) should be accessable from the client network.

PolarProxy could be used to pivot from the client network into the analyst network or to access the Apache webserver running on the Security Onion node. For example, the following curl command can be used to access the local Apache server running on the Security Onion machine via PolarProxy:

curl --insecure --connect-to localhost:443:[SecurityOnionIP]:10443 https://localhost/
We therefore recommend adding firewall rules that prevent PolarProxy from accessing the analyst network as well as the local Apache server.

Hardening Steps:

  • Configure the Security Onion node as a Forward Node
  • Segment client network from analyst network
  • Add firewall rules to prevent PolarProxy from accessing services on the local machine and analyst network

For additional info on hardening, please see the recommendations provided by Wes Lambert on the Security-Onion mailing list.

Posted by Erik Hjelmvik on Monday, 20 January 2020 09:40:00 (UTC/GMT)

Tags: #SecurityOnion#Security Onion#PCAP#Bro#Zeek#PolarProxy#Snort#Suricata#TLS#SSL#HTTPS#tcpreplay#PCAP-over-IP#IDS#NIDS#netcat#curl#UFW#ASCII-art

Share: Facebook   Twitter   Reddit   Hacker News Short URL: https://netresec.com/?b=2013af4


PolarProxy Released

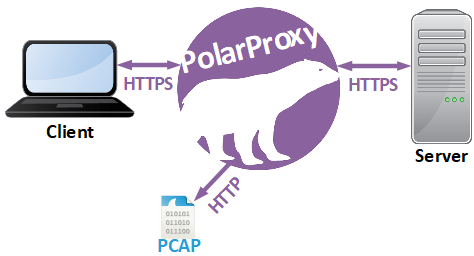
I’m very proud to announce the release of PolarProxy today! PolarProxy is a transparent TLS proxy that decrypts and re-encrypts TLS traffic while also generating a PCAP file containing the decrypted traffic.

PolarProxy flow chart

PolarProxy enables you to do lots of things that have previously been impossible, or at least very complex, such as:

  • Analyzing HTTP/2 traffic without an SSLKEYLOGFILE
  • Viewing decrypted HTTPS traffic in real-time using Wireshark
    PolarProxy -p 10443,80,443 -w - | wireshark -i - -k
  • Replaying decrypted traffic to an internal or external interface using tcpreplay
    PolarProxy -p 10443,80,443 -w - | tcpreplay -i eth1 -
  • Forwarding of decrypted traffic to a NIDS (see tcpreplay command above)
  • Extracting DNS queries and replies from DNS-over-TLS (DoT) or DNS-over-HTTPS (DoH) traffic
    PolarProxy -p 853,53 -p 443,80 -w dns.pcap
  • Extracting email traffic from SMTPS, POP3S or IMAPS
    PolarProxy -p 465,25 -p 995,110 -p 993,143 -w emails.pcap

Here is an example PCAP file generated by PolarProxy:
https://media.netresec.com/pcap/polarproxy-demo.pcap

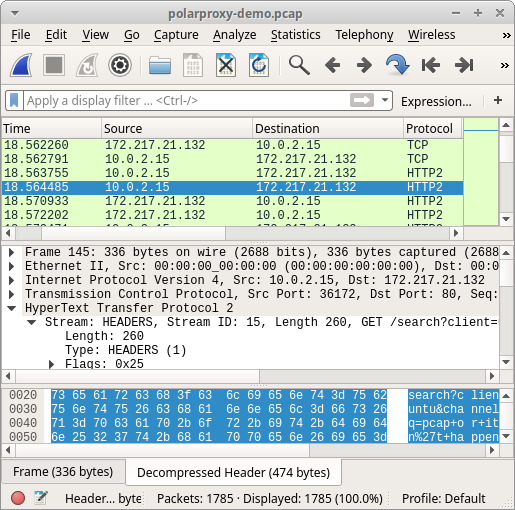
This capture files contains HTTP, WebSocket and HTTP/2 packets to Mozilla, Google and Twitter that would otherwise have been encrypted with TLS.

 HTTP/2 traffic from PolarProxy opened in Wireshark
Image: HTTP/2 traffic from PolarProxy opened in Wireshark

Now, head over to our PolarProxy page and try it for yourself (it’s free)!

Posted by Erik Hjelmvik on Friday, 21 June 2019 06:00:00 (UTC/GMT)

Tags: #PolarProxy#PCAP#NIDS#IDS#http2#HTTP/2#Wireshark#tcpreplay#DoH#SMTPS#IMAPS#TLS#SSL

Share: Facebook   Twitter   Reddit   Hacker News Short URL: https://netresec.com/?b=196571b


Detecting the Pony Trojan with RegEx using CapLoader

This short video demonstrates how you can search through PCAP files with regular expressions (regex) using CapLoader and how this can be leveraged in order to improve IDS signatures.

The EmergingThreats snort/suricata rule mentioned in the video is SID 2014411 “ET TROJAN Fareit/Pony Downloader Checkin 2”.

The header accept-encoding header with quality factor 0 used by the Pony malware is:
Accept-Encoding: identity, *;q=0

And here is the regular expression used to search for that exact header: \r\nAccept-Encoding: identity, \*;q=0\r\n

After recording the video I noticed that the leaked source code for Pony 2.0 actually contains this accept-encoding header as a hard-coded string. Have a look in the redirect.php file, where they set curl’s CURLOPT_HTTPHEADER to this specific string.

Pony using curl to set: Accept-Encoding: identity, *;q=0

Wanna learn more about the intended use of quality factors in HTTP accept headers? Then have a look at section 14.1 of RFC 2616section 5.3.4 of RFC 7231, which defines how to use qvalues (i.e. quality factors) in the Accept-Encoding header.

Finally, I'd like to thank Brad Duncan for running the malware-traffic-analysis.net website, your PCAP files often come in handy!

Update 2018-07-05

I submitted a snort/suricata signature to the Emerging-Sigs mailinglist after publishing this blog post, which resulted in the Emerging Threats signature 2014411 being updated on that same day to include:

content:"|0d 0a|Accept-Encoding|3a 20|identity,|20 2a 3b|q=0|0d 0a|"; http_header;

Thank you @EmergingThreats for the fast turnaround!

Posted by Erik Hjelmvik on Wednesday, 04 July 2018 07:39:00 (UTC/GMT)

Tags: #video#regex#malware#IDS#curl#malware-traffic-analysis.net#videotutorial

Share: Facebook   Twitter   Reddit   Hacker News Short URL: https://netresec.com/?b=187e291


Examining an x509 Covert Channel

Jason Reaves gave a talk titled “Malware C2 over x509 certificate exchange” at BSides Springfield 2017, where he demonstrated that the SSL handshake can be abused by malware as a covert command-and-control (C2) channel.

Jason Reaves presenting at BSides Springfield 2017

He got the idea while analyzing the Vawtrak malware after discovering that it read multiple fields in the X.509 certificate provided by the server before proceeding. Jason initially thought these fields were used as a C2 channel, but then realized that Vawtrak performed a variant of certificate pinning in order to discover SSL man-in-the-middle attempts.

Nevertheless, Jason decided to actually implement a proof-of-concept (PoC) that uses the X.509 certificate as a C2 channel. Jason’s code is now available on GitHub along with a PCAP file demonstrating this covert C2 channel. Of course I couldn’t resist having a little look at this PCAP file in NetworkMiner.

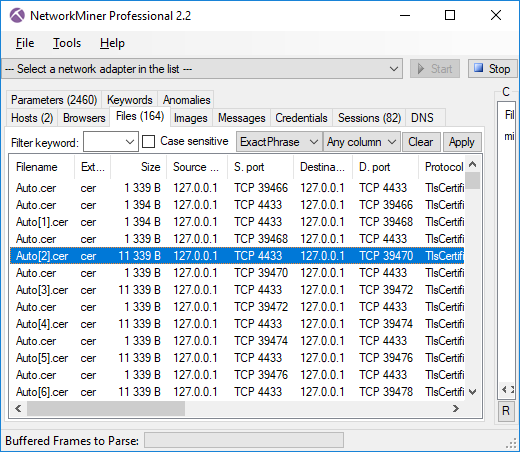
The first thing I noticed was that the proof-of-concept PCAP ran the SSL session on TCP 4433, which prevented NetworkMiner from parsing the traffic as SSL. However, I was able to parse the SSL traffic with NetworkMiner Professional just fine thanks to the port-independent-protocol-identification feature (a.k.a Dynamic Port Detection), which made the Pro-version parse TCP 4433 as SSL/TLS.

X.509 certificates extracted from PCAP with NetworkMiner
Image: X.509 certificates extracted from PCAP with NetworkMiner

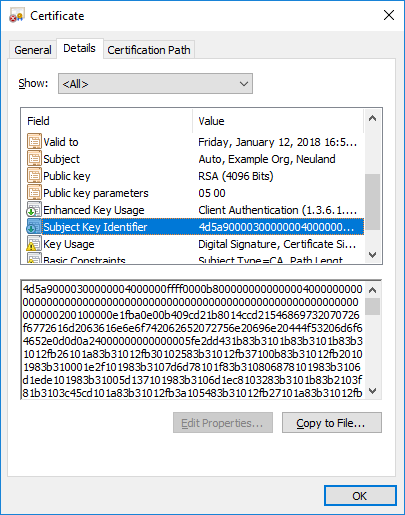
A “normal” x509 certificate size is usually around 1kB, so certificates that are 11kB should be considered as anomalies. Also, opening one of these .cer files reveals an extremely large value in the Subject Key Identifier field.

X.509 certificate with MZ header in the Subject Key Identifier field

Not only is this field very large, it also starts with the familiar “4D 5A” MZ header sequence.

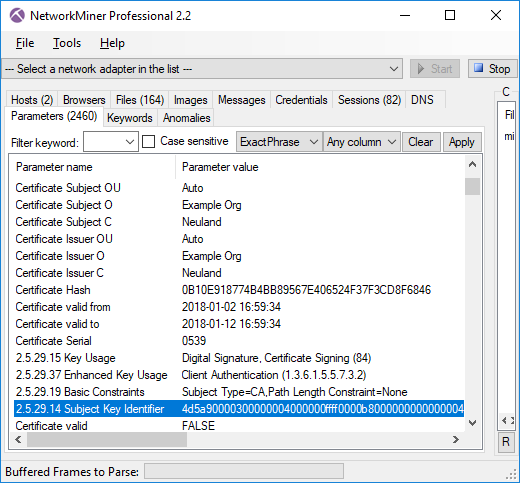
NetworkMiner additionally parses details from the certificates that it extracts from PCAP files, so the Subject Key Identifier field is actually accessible from within NetworkMiner, as shown in the screenshot below.

Parameters tab in NetworkMiner showing X.509 certificate details

You can also see that NetworkMiner validates the certificate using the local trusted root certificates. Not surprisingly, this certificates is not trusted (certificate valid = FALSE). It would be most unlikely that anyone would manage to include arbitrary data like this in a signed certificate.


Extracting the MZ Binary from the Covert X.509 Channel

Even though NetworkMiner excels at pulling out files from PCAPs, this is definitively an occasion where manual handling is required. Jason’s PoC implementation actually uses a whopping 79 individual certificates in order to transfer this Mimikatz binary, which is 785 kB.

Here’s a tshark oneliner you can use to extract the Mimikatz binary from Jason's example PCAP file.

tshark -r mimikatz_sent.pcap -Y 'ssl.handshake.certificate_length gt 2000' -T fields -e x509ce.SubjectKeyIdentifier -d tcp.port==4433,ssl | tr -d ':\n' | xxd -r -p > mimikatz.exe

Detecting x509 Anomalies

Even though covert channels using x509 certificates isn’t a “thing” (yet?) it’s still a good idea to think about how this type of covert signaling can be detected. Just looking for large Subject Key Identifier fields is probably too specific, since there are other fields and extensions in X.509 that could also be used to transmit data. A better approach would be to alert on certificates larger than, let’s say, 3kB. Multiple certificates can also be chained together in a single TLS handshake certificate record, so it would also make sense to look for handshake records larger than 8kB (rough estimate).

Bro IDS logo

This type of anomaly-centric intrusion detection is typically best done using the Bro IDS, which provides easy programmatic access to the X.509 certificate and SSL handshake.

There will be false positives when alerting on large certificates in this manner, which is why I recommend to also check if the certificates have been signed by a trusted root or not. A certificate that is signed by a trusted root is very unlikely to contain malicious data.

Posted by Erik Hjelmvik on Tuesday, 06 February 2018 12:13:00 (UTC/GMT)

Tags: #malware#C2#SSL#TLS#certificate#NetworkMiner#PCAP#x509#X.509#PIPI#Bro#IDS#tshark

Share: Facebook   Twitter   Reddit   Hacker News Short URL: https://netresec.com/?b=182e662


Rinse-Repeat Intrusion Detection

I am a long time skeptic when it comes to blacklists and other forms of signature based detection mechanisms. The information security industry has also declared the signature based anti-virus approach dead several times during the past 10 years. Yet, we still rely on anti-virus signatures, IDS rules, IP blacklists, malware domain lists, YARA rules etc. to detect malware infections and other forms of intrusions in our networks. This outdated approach puts a high administrative burden on IT and security operations today, since we need to keep all our signature databases up to date, both when it comes to end point AV signatures as well as IDS rules and other signature based detection methods and threat feeds. Many organizations probably spend more time and money on updating all these blacklists and signature databases than actually investigating the security alerts these detection systems generate. What can I say; the world is truly upside down...

Shower image by Nevit Dilmen Image: Shower by Nevit Dilmen.

I would therefore like to use this blog post to briefly describe an effective blacklist-free approach for detecting malware and intrusions just by analyzing network traffic. My approach relies on a combination of whitelisting and common sense anomaly detection (i.e. not the academic statistical anomaly detection algorithms that never seem to work in reality). I also encourage CERT/CSIRT/SOC/SecOps units to practice Sun Tzu's old ”know yourself”, or rather ”know your systems and networks” approach.

Know your enemy and know yourself and you can fight a hundred battles without disaster.
- Sun Tzu in The Art of War
Art of War in Bamboo by vlasta2
Image: Art of War in Bamboo by vlasta2

My method doesn't rely on any dark magic, it is actually just a simple Rinse-Repeat approach built on the following steps:

  1. Look at network traffic
  2. Define what's normal (whitelist)
  3. Remove that
  4. GOTO 1.

After looping through these steps a few times you'll be left with some odd network traffic, which will have a high ratio of maliciousness. The key here is, of course, to know what traffic to classify as ”normal”. This is where ”know your systems and networks” comes in.


What Traffic is Normal?

I recently realized that Mike Poor seems to be thinking along the same lines, when I read his foreword to Chris Sanders' and Jason Smith's book Applied NSM:

The next time you are at your console, review some logs. You might think... "I don't know what to look for". Start with what you know, understand, and don't care about. Discard those. Everything else is of interest.

Applied NSM

Following Mike's advice we might, for example, define“normal” traffic as:

  • HTTP(S) traffic to popular web servers on the Internet on standard ports (TCP 80 and 443).
  • SMB traffic between client networks and file servers.
  • DNS queries from clients to your name server on UDP 53, where the servers successfully answers with an A, AAAA, CNAME, MX, NS or SOA record.
  • ...any other traffic which is normal in your organization.

Whitelisting IP ranges belonging to Google, Facebook, Microsoft and Akamai as ”popular web servers” will reduce the dataset a great deal, but that's far from enough. One approach we use is to perform DNS whitelisting by classifying all servers with a domain name listed in Alexa's Top 1 Million list as ”popular”.

You might argue that such a method just replaces the old blacklist-updating-problem with a new whitelist-updating-problem. Well yes, you are right to some extent, but the good part is that the whitelist changes very little over time compared to a blacklist. So you don't need to update very often. Another great benefit is that the whitelist/rinse-repeat approach also enables detection of 0-day exploits and C2 traffic of unknown malware, since we aren't looking for known badness – just odd traffic.


Threat Hunting with Rinse-Repeat

Mike Poor isn't the only well merited incident handler who seems to have adopted a strategy similar to the Rinse-Repeat method; Richard Bejtlich (former US Air Force CERT and GE CIRT member) reveal some valuable insight in his book “The Practice of Network Security Monitoring”:

I often use Argus with Racluster to quickly search a large collection of session data via the command line, especially for unexpected entries. Rather than searching for specific data, I tell Argus what to omit, and then I review what’s left.

In his book Richard also mentions that he uses a similar methodology when going on “hunting trips” (i.e. actively looking for intrusions without having received an IDS alert):

Sometimes I hunt for traffic by telling Wireshark what to ignore so that I can examine what’s left behind. I start with a simple filter, review the results, add another filter, review the results, and so on until I’m left with a small amount of traffic to analyze.

The Practice of NSM

I personally find Rinse-Repeat Intrusion Detection ideal for threat hunting, especially in situations where you are provided with a big PCAP dataset to answer the classic question “Have we been hacked?”. However, unfortunately the “blacklist mentality” is so conditioned among incident responders that they often choose to crunch these datasets through blacklists and signature databases in order to then review thousands of alerts, which are full of false positives. In most situations such approaches are just a huge waste of time and computing power, and I'm hoping to see a change in the incident responders' mindsets in the future.

I teach this “rinse-repeat” threat hunting method in our Network Forensics Training. In this class students get hands-on experience with a dataset of 3.5 GB / 40.000 flows, which is then reduced to just a fraction through a few iterations in the rinse-repeat loop. The remaining part of the PCAP dataset has a very high ratio of hacking attacks as well as command-and-control traffic from RAT's, backdoors and botnets.


UPDATE 2015-10-07

We have now published a blog post detailing how to use dynamic protocol detection to identify services running on non-standard ports. This is a good example on how to put the Rinse-Repeat methodology into practice.

Posted by Erik Hjelmvik on Monday, 17 August 2015 08:45:00 (UTC/GMT)

Tags: #Rinse-Repeat#PCAP#NSM#PCAP#Intrusion Detection#IDS#network forensics

Share: Facebook   Twitter   Reddit   Hacker News Short URL: https://netresec.com/?b=1582D1D


PCAP or it didn't happen

The phrase "PCAP or it didn't happen" is often used in the network security field when someone want proof that an attack or compromise has taken place. One such example is the recent OpenSSL heartbleed vulnerability, where some claim that the vulnerability was known and exploited even before it was discovered by Google's Neel Mehta and Codenomicon.

PCAP or it didn't happen pwnie, original by Nina on http://n924.deviantart.com
Image: PCAP or it didn't happen pwnie, original by Nina

After the Heartbleed security advisory was published, EFF tweeted:

"Anyone reproduced observations of #Heartbleed attacks from 2013?"
and Liam Randall (of Bro fame) tweeted:
"If someone finds historical exploits of #Heartbleed I hope they can report it. Lot's of sites mining now."

Liam Randall (@Hectaman) tweeting about historical Heartbleed searches Heartbleed

It is unfortunately not possible to identify Heartbleed attacks by analyzing log files, as stated by the following Q&A from the heartbleed.com website:

Can I detect if someone has exploited this against me?

Exploitation of this bug does not leave any trace of anything abnormal happening to the logs.

Additionally, IDS  signatures  for detecting the Heartbleed attacks weren't available until after implementations of the exploit code were being actively used in the wild.

Hence, the only reliable way of detecting early heartbleed attacks (i.e. prior to April 7) is to analyze old captured network traffic from before April 7. In order to do this you should have had a full packet capture running, which was configured to capture and store all your traffic. Unfortunately many companies and organizations haven't yet realized the value that historical packet captures can provide.

Why Full Packet Capture Matters

Some argue that just storing netflow data is enough in order to do incident response. However, detecting events like the heartbleed attack is impossible to do with netflow since you need to verify the contents of the network traffic.

Not only is retaining historical full packet captures useful in order to detect attacks that have taken place in the past, it is also extremely valuable to have in order to do any of the following:

  • IDS Verification
    Investigate IDS alerts to see if they were false positives or real attacks.

  • Post Exploitation Analysis
    Analyze network traffic from a compromise to see what the attacker did after hacking into a system.

  • Exfiltration Analysis
    Assess what intellectual property that has been exfiltrated by an external attacker or insider.

  • Network Forensics
    Perform forensic analysis of a suspect's network traffic by extracting files, emails, chat messages, images etc.

Setting up a Full Packet Capture

netsniff-ng logo

The first step, when deploying a full packet capture (FPC) solution, is to install a network tap or configure a monitor port in order to get a copy of all packets going in and out from your networks. Then simply sniff the network traffic with a tool like dumpcap or netsniff-ng. Another alternative is to deploy a whole network security monitoring (NSM) infrastructure, preferably by installing the SecurityOnion Linux distro.

A network sniffer will eventually run out of disk, unless captured network traffic is written to disk in a rung buffer manner (use "-b files" switch in dumpcap) or there is a scheduled job in place to remove the oldest capture files. SecurityOnion, for example, normally runs its "cleandisk" cronjob when disk utilization reaches 90%.

The ratio between disk space and utilized bandwidth becomes the maximum retention period for full packet data. We recommend having a full packet capture retention period of at least 7 days, but many companies and organizations are able to store several month's worth of network traffic (disk is cheap).

Big Data PCAP Analysis

Okay, you've got a PCAP store with multiple terabytes of data. Then what? How do you go about analyzing such large volumes of captured full content network traffic? Well, tasks like indexing and analyzing PCAP data are complex matters than are beyond the scope of this blog post. We've covered the big data PCAP analysis topic in previous  blog posts, and there is more to come. However, capturing the packets to disk is a crucial first step in order to utilize the powers of network forensics. Or as the saying goes “PCAP or it didn't happen”.

Posted by Erik Hjelmvik on Thursday, 01 May 2014 21:45:00 (UTC/GMT)

Tags: #capture#sniffer#IDS#forensics

Share: Facebook   Twitter   Reddit   Hacker News Short URL: https://netresec.com/?b=1452D4C

X / twitter

NETRESEC on X / Twitter: @netresec

Mastodon

NETRESEC on Mastodon: @netresec@infosec.exchange